Marketing and Sales Funnel
How much Budget to allocate on Marketing versus Sales?
Launching your product and accelerating digital growth
Concepts, Tools, Templates
When you planned your new product or service development you probably put a placeholder for sales and marketing in your budget plan. Once you received a “go” for your business case put that stake in the ground your sales and marketing teams start developing ideas and competing for resources. Soon you arrive at a decision point:
How much to spend on sales versus marketing to launch your product and accelerate growth?
It is an old battle, but it has a new relevance:
- If you bet on the wrong mix and timing you could miss the momentum and risk loosing the market.
- The new tools and concepts for both sales and for digital marketing can set your business up for different growth trajectories.
- Once you have locked down on a particular strategy, it is somewhat hard to revise quickly.
Therefore, it would be a good idea to consider different alternatives and gain insights on the upside potential and downside risk of each alternative.
In this blog post I am walking you through some concepts and ideas. The content is related to an idea,- cast episode with a video briefing, tools and templates.
Idea,- Cast is a briefing and coaching series with bite sized episodes, video briefings, tools and templates. More…
Marketing and Sales Funnel
Let’s step back for a moment and revisit the sales and marketing funnel. The idea of the funnel is to convert potential customers into trial customers and finally into paying customers.
The funnel and customer journey can have many steps, because at the beginning the potential customers may be completely unaware of your product and service and even of your company. And it is very unlikely that a customer is engaging right away and purchases the product. Therefore the steps in the funnel usually involve several phases:
- Awareness
- Interest
- Desire
- Consideration
- Action
- Referral.
The last step “referral” is often not considered. But it is essential if you want to leverage the positive and very cost effective effects of word-of-mouth promotion.
Also, when we speak about the sales marketing funnel we need to consider that different content and strategies are required at the top end of the funnel versus downstream.
But coming back to the topic of this post, the question is:
What is driving performance in the sales and marketing funnel?
In other words:
- What are the levers?
- What are the key performance indicators?
- And what is your assumption about each of these factors.
The parameters are different for sales and marketing.
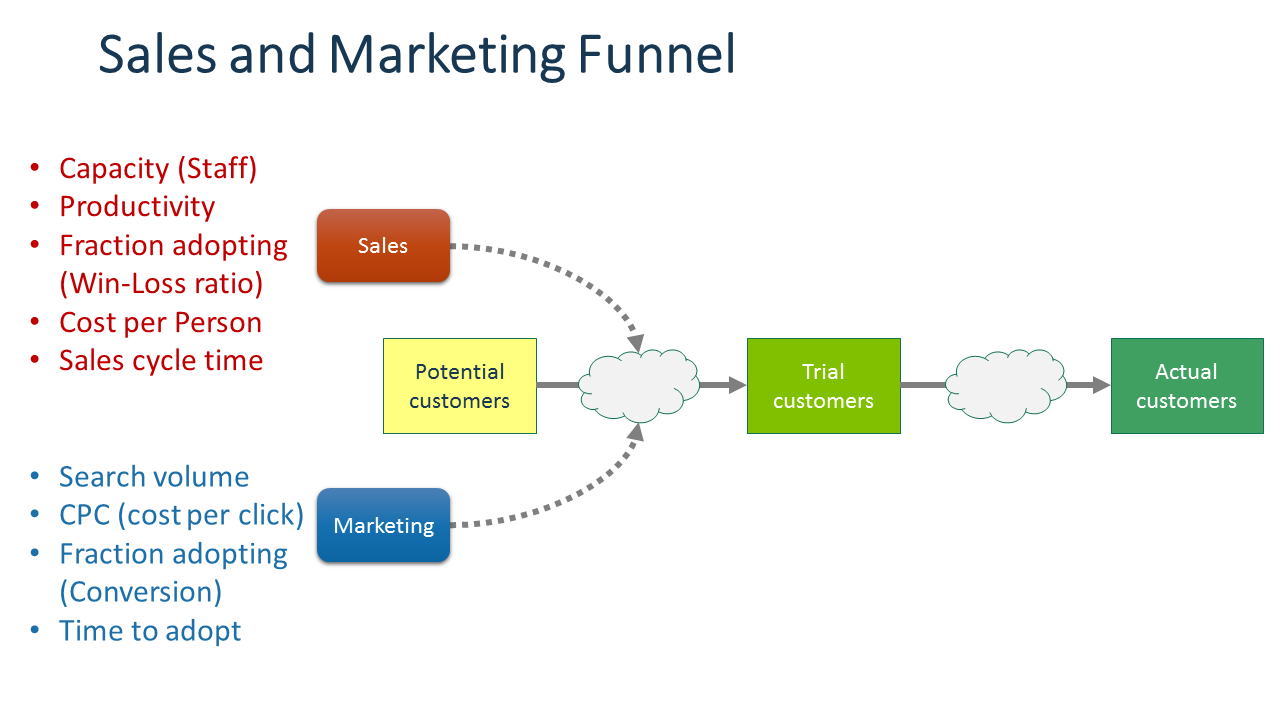
Marketing and sales funnel and KPI
Strategic and dynamic feedback structure
There are many feedback loops in a business system. But then it comes to new product launches and accelerating growth you may want to focus on two key aspects:
- Word-of-mouth feedback: the more customers you have, the more engage and happy they are, and the more active they are in terms of their influence on others, the higher the impact on potential customers. In short, more active customers drive more potential customers into your sales and marketing funnel
- Organic revenue growth: The more paying customers you have, the more funds you can allocate to sales and marketing.
The “Referral” steps in the sales and marketing funnels are important. These touch points can occur already in the trial phase and you can leverage the positive customer experience to provide incentives both for signing up and for promoting the product within their network.
And the word-of-mouth promotion opportunity continues when customers sign up and you keep them engaged, active and happy.
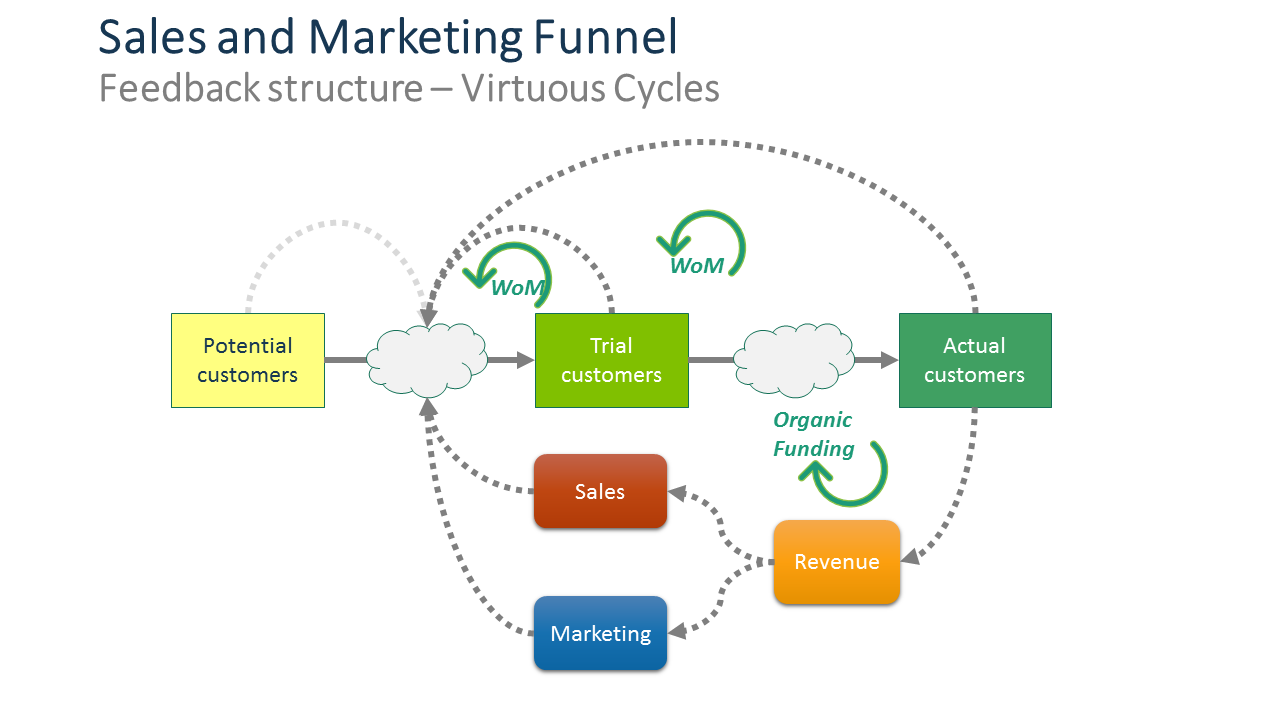
Sales marketing funnel feedback structure
This feedback structure is at the core of your growth initiative. And it can determine success and failure.
Accounting for the impact of dynamic feedback is a bit more challenging. We will talk about business simulation based on this feedback structure a bit later in this article.
Let’s first tackle the basics and some low hanging fruit.
Marketing and Sales Funnel Productivity
As a first step we want to estimate the expected productivity of the respective sales and marketing funnel. We need to make our assumptions transparent. The first question you will often hear is:
How do you know the values of the KPI?
True, at this stage we do not know what the real performance is. We are in the planning stage and there is no experience with the funnel yet.
The key point is to make your assumptions transparent. This has several benefits:
- It helps you identifying the key levers.
- You are making your mental model transparent.
- It facilities a discussion in your team.
- It supports the learning process. Later you can review and adjust your assumptions.
- You can set performance goals for your team and vendors.
The assumptions about your sales funnel productivity should include estimates about
- Effort per customer
- Win-Loss-Ratio
- Utilization and effective, available capacity
- Employee compensation
- Delays and cycle time
It is better to make assumptions transparent and learn as you go.
Here is an example how your calculation model may look like.
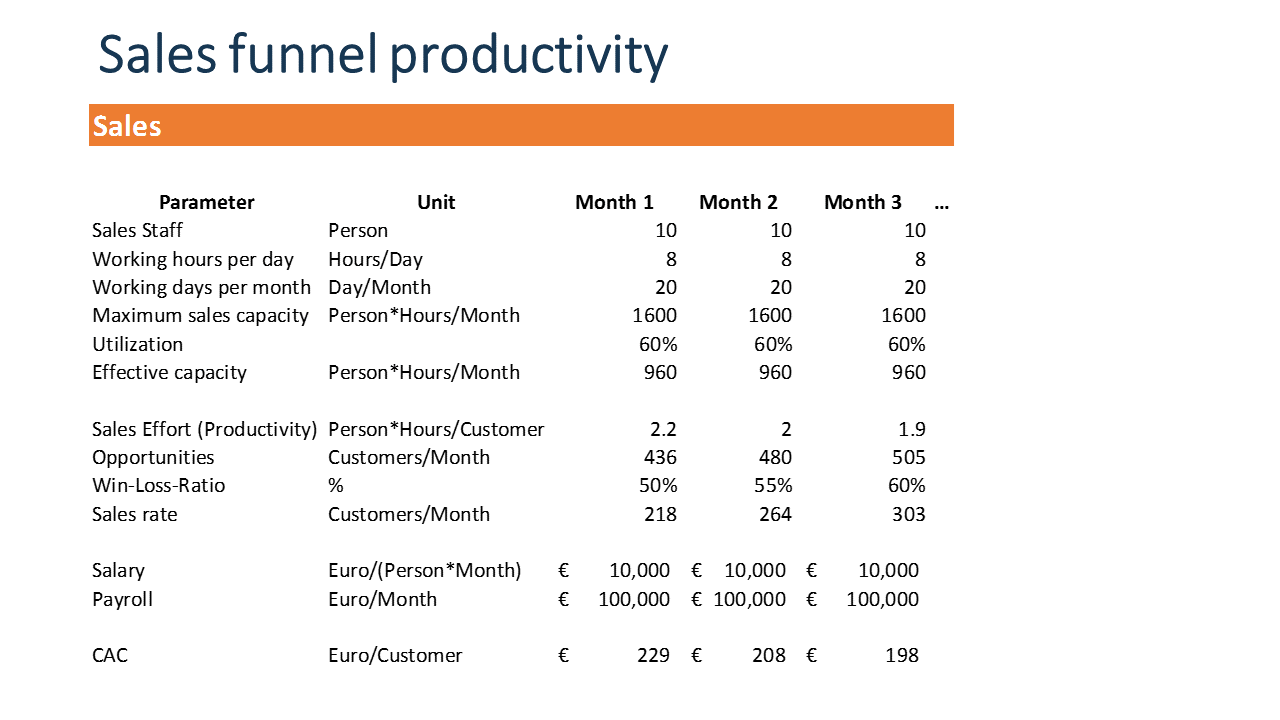
Excel template for sales funnel productivity KPI
Building the calculation model for the marketing funnel
As a next step you can build a calculation model for the marketing funnel. Again, the steps can be more differentiated, but you may want to capture your assumptions about
- Search volume: this gives and indication of the demand side.
- CTR (Click-through-rate)
- Conversion
- CPC (Cost-per-Click) or CPM (Cost per thousand impressions).
Here is an example how your calculation model may look like.
Note the timeline. This is another dimension. It helps you articulate how you believe the parameters will change over time. This can be due to several factors:
- learning effects
- improvement efforts
- efficiency gains
- changing market conditions and competition
- competition for marketing instruments
For example when Facebook, Google & Co. introduce a new advertisement opportunity the prices are initially fairly attractive. But as demands picks up, the prices increase. This is just a matter of the market forces of supply, demand and competition.
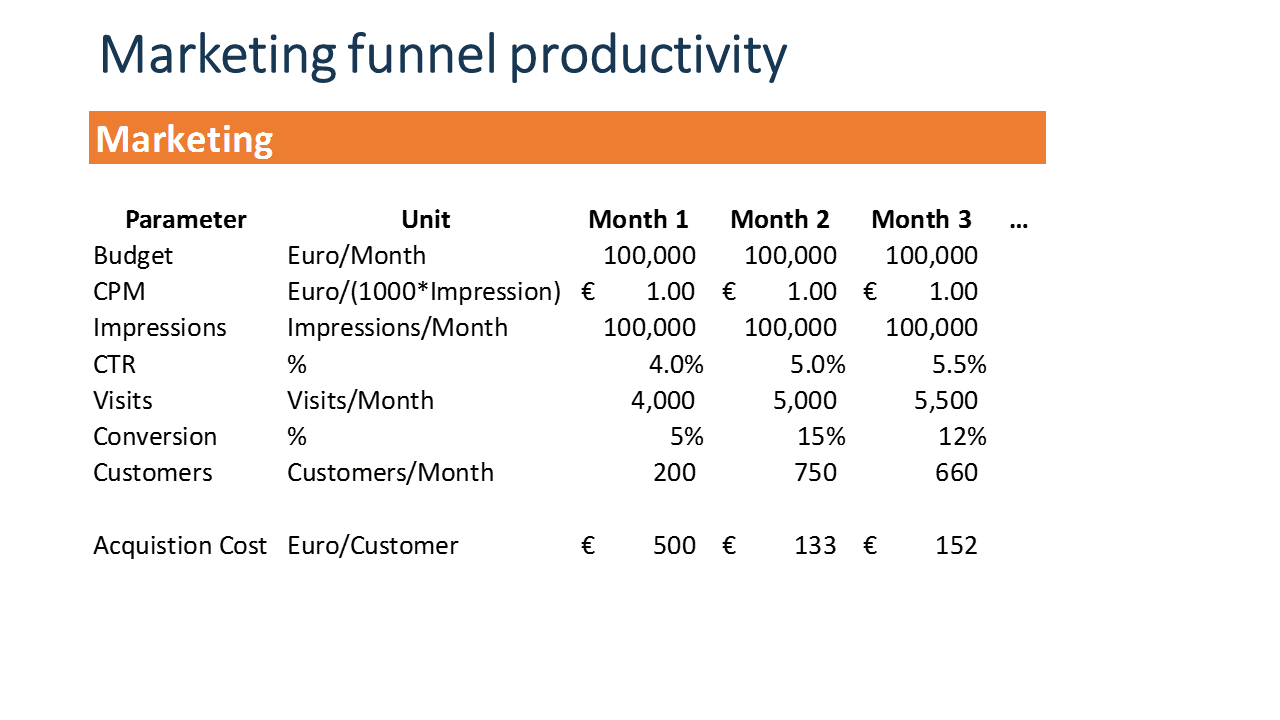
Excel worksheet template marketing funnel productivity KPI
Now you have a basis for having a dialogue about your strategies and tactics. This helps you to make informed decisions.
As next step you can bring this together into a dashboard.
The question is:
How do the strategies and tactics contribute to overall performance over time?
The dashboard should consider a balanced mix of
- Financial metrics: Revenue, Customer Acquisition cost, Profit contribution.
- Customer base metrics, such as new customer growth and churn.
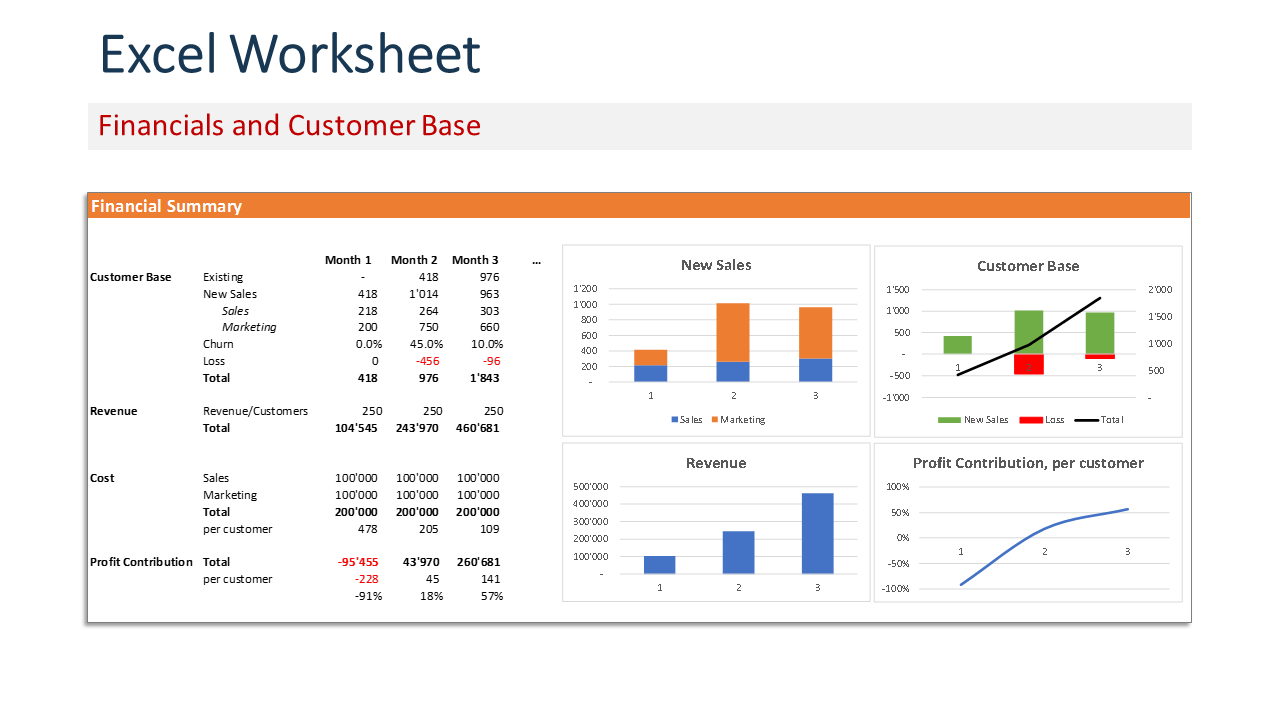
Excel worksheet template. dashboard of sales and marketing funnel KIP
Decomposing the cost elements
In this example we did not include all the cost elements you would need to calculate the true CAC (Customer Acquisition cost) such as:
- IT infrastructure: CRM, Marketing Tools
- Design and creative services
- Company overhead.
You can add these easily to the worksheet. In some cases it may be desirable to articulate the cost elements in more detail versus including them in the so called “fully loaded cost” on a per employee basis. Breaking the cost elements out is helpful for monitoring and systemic improvement purposes.
For example, you can articulate your cost per case (opportunity) as
Cost per case = Minutes per Case x Cost per Minute
This allows you to focus on two key decisions which contribute to cost per case:
- Minutes per case is driven by employee productivity.
- Cost per Minute may be driven for example by your location and sourcing strategy.
Disintegrating the Key Performance Metrics is helpful for decision making and performance management.
Dealing with Uncertainty: Sensitivity and risk analysis
Before your product launch you do not have any data which helps you to support your decisions. If you are lucky, you can use past product launches or industry data.
But working with static data is a bit dangerous. For example, how sure can you be that the “Effort per customer” is exactly 3 Person-Hours/Customer? It could be as low as 2 or as high as 5. And the impact on your estimated performance and productivity is significant.
In order to get a better sense of the upside opportunity and downside risk you can do a sensitivity analysis.
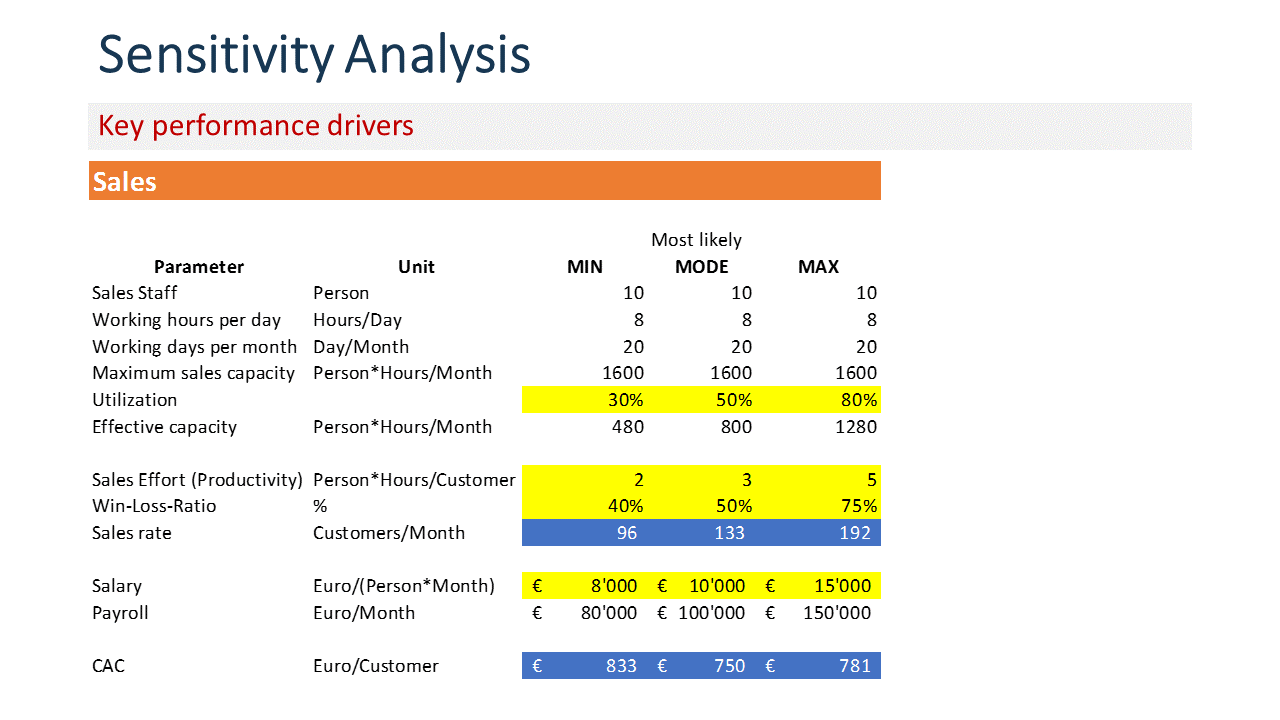
Sensitivity analysis of Key Performance Indicator KPI for sales funnel productivity
In our example we are estimating the potential ranges and the most likely value for a parameter.
Again, there are several ways to include this information:
- Historical data
- Expert opinions
- Controlled experiments
Now we are moving from a point estimate to a distribution of possible values for each parameter.
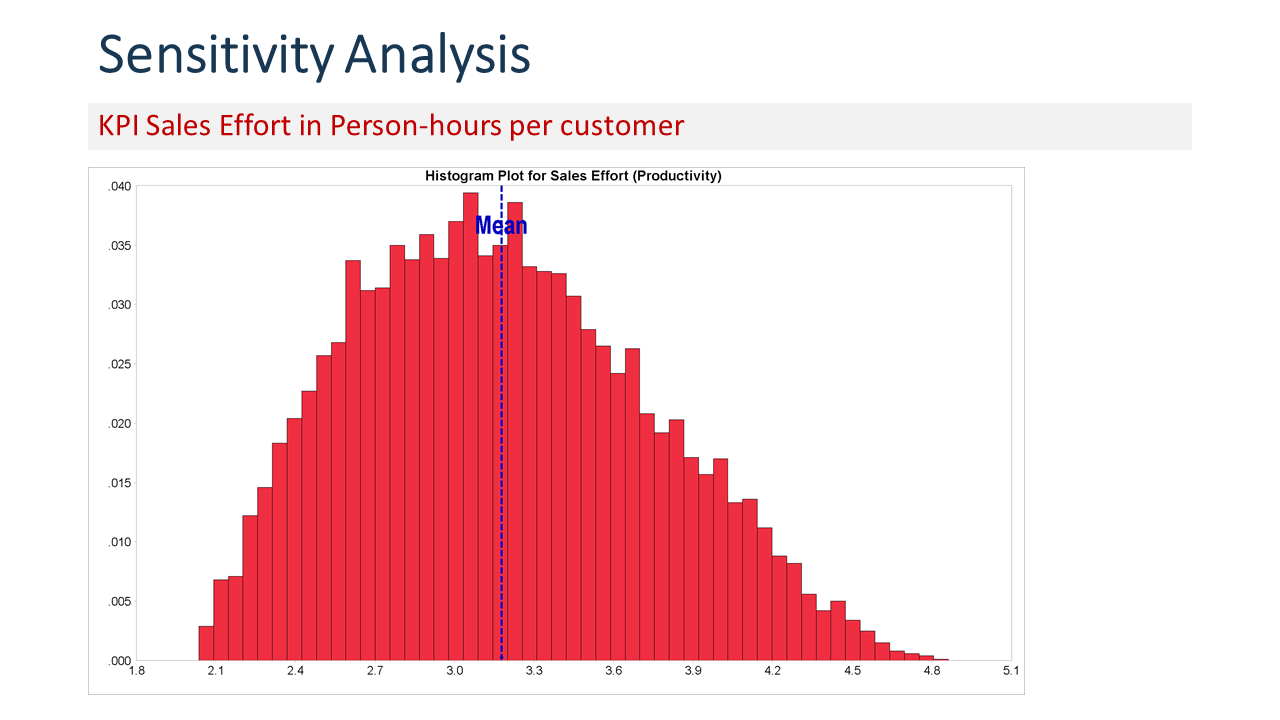
Risk simulation of sales and marketing funnel Key Performance Indicator KPI.
In this case we are looking at the distribution of “Sales Effort”: the likelihood is highest around the mode, and it is shifted more towards the lower end. In other words, we assume that the lower sales effort per customer is more likely to occur.
Once we have historical data from the initial phase of our product launch we can update this information and improve our estimate.
This way we can take the uncertainty out of the equation step by step.
Note: the horizontal x-axis shows “Profit contribution per customer”.
Using the Monte Carlo simulation approach we can simulate possible outcomes of our sales and marketing funnel.
In this case we can 10’000 simulations. Each simulation contains a different set and combination of possible values of the KPI.
Insights from the simulation
In our example we get some new insights:
- Both approaches (marketing vs sales) produce similar outcomes around the average performance.
- The sales funnel has a tighter distribution. This indicates that the performance is somewhat more predictable.
- The marketing funnel can deliver more upside opportunity. It has the potential to create a higher sales volume.
- The marketing funnel also has more downside risk. It has a higher likelihood to produce inferior performance and losses. This is indicated by the larger surface under the curve, below the zero profit contribution.
Now we can make a more informed decisions about which strategies and tactics support the business goals and the appetite for risk.
More importantly, you can ask better questions now during the budget and project reviews:
- Why is there such a variation in effort per customer?
- What is driving this?
- Should we segment the customer and design different sales and marketing approaches for each segment?
- What is driving the variation in conversion rate?
- Which keywords and ads drive higher CTR?
- etc.
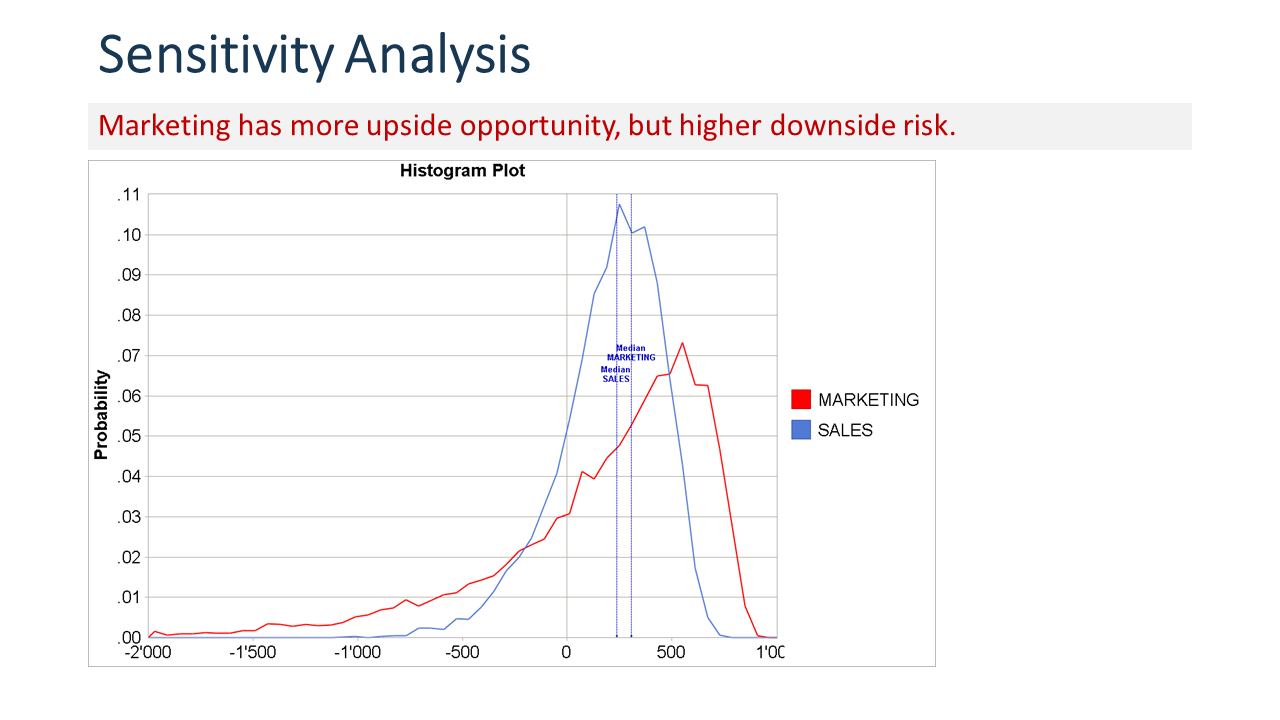
Simulation results for sales and marketing KPI Key Performance Indicators.
Conclusion
Choosing the right strategies, tactics and resource allocation mix for your product launch and growth acceleration is key.
The sales and marketing funnels have different dynamics. Also, the risk and opportunity profile of each funnel and each project and campaign is different.
Make your assumptions transparent with a calculation model of expected performance. Update your findings as you get new data points from market tests, experiments and from ongoing campaigns.
By using performance simulation you can get additional insights about the risk-return-profile of your sales and marketing funnel, of projects and campaigns.
Watch the video and visit the idea,- cast resource and briefing center for tools, templates and upcoming episodes.
Which of these strategies and tactics have you applied? Let me know and and good luck with your next pitch and business case presentation!
