Why 90% of Digital Marketing Campaigns Fail (And How to Fix Yours)
The hidden reason behind campaign failures isn’t budget, targeting, or creative – it’s impatience with the wrong metrics. Look at the right marketing campaign KPIs at the right time. And curb your impatience!
Picture this: Your Google Ads campaign launches on Monday. By Wednesday, the cost-per-click is higher than expected. Thursday brings a tense meeting about “disappointing performance.” Friday? The campaign gets scrapped.
Sound familiar? You’re not alone. This scenario plays out in marketing departments worldwide, burning through budgets and crushing team morale.
The real culprit isn’t your ad platform, audience targeting, or creative strategy. It’s a fundamental misunderstanding of when to measure what in your campaign lifecycle.
The Million-Dollar Question: What Should You Track First?
Most marketing teams drown in data. They have access to dozens of metrics but lack a clear framework for prioritizing them. The result? Decision paralysis or, worse, premature optimization that kills promising campaigns.
At WITTIGONIA, we’ve refined a systematic approach that transforms chaotic campaign management into predictable growth. Our three-stage KPI framework has helped clients across industries make data-driven decisions without getting overwhelmed by vanity metrics.
The Three-Stage Marketing Campaign KPI Framework: Traction → Efficiency → Financials
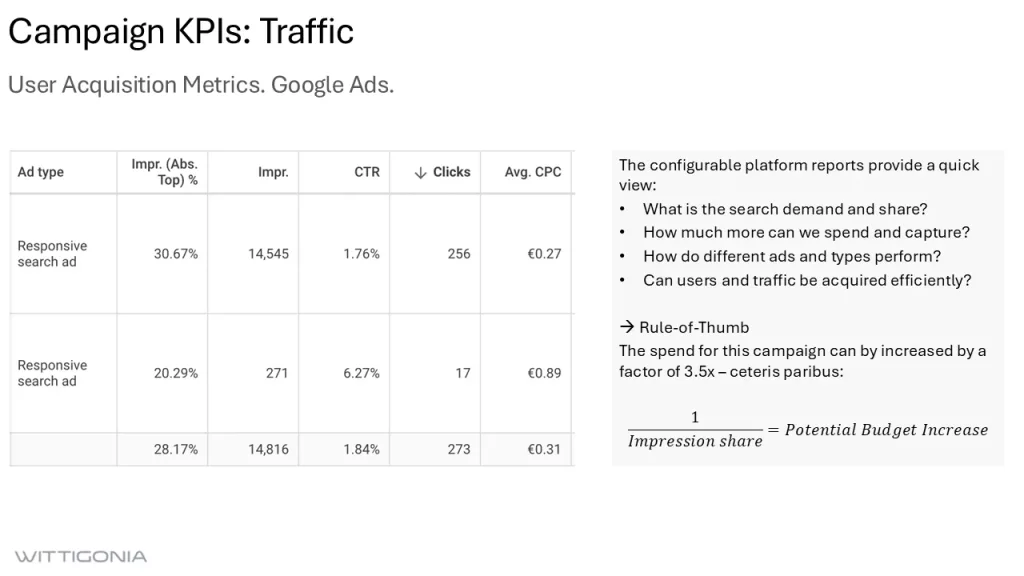
Stage 1: Traction KPIs (Week 1-2) – “Are We Getting Noticed?”
Before you worry about costs or conversion rates, establish basic campaign momentum.
Primary metrics to track:
- Impressions: Is your ad actually showing up?
- Clicks and website visits: Are people interested enough to engage?
- Conversions: Is anyone taking your desired action?
This isn’t about performance quality yet. You’re simply validating that your campaign machinery is working. Think of it as checking if your car starts before worrying about fuel efficiency.
Common mistake: Teams panic when early clicks are expensive. Don’t. Every platform has a learning phase where costs spike as algorithms optimize targeting.

Stage 2: Efficiency KPIs (Week 3-4) – “Are We Attracting the Right People?”
Once you’ve confirmed basic traction, shift focus to quality metrics.
Primary metrics to track:
- Click-through rate (CTR): Does your ad resonate with your target audience?
- Conversion rate (CVR): Are visitors finding what they expected?
These efficiency metrics reveal alignment issues between your ad copy, targeting, and landing page experience. A low CTR might indicate messaging problems, while a low CVR could signal landing page friction.
Optimization opportunity: Small tweaks to headline copy or audience targeting often yield significant improvements at this stage.
Stage 3: Financial KPIs (Week 4+) – “Is This Sustainable?”
Only after establishing traction and efficiency should you evaluate financial performance.
Primary metrics to track:
- Cost per click (CPC): Are you paying reasonable rates for traffic?
- Cost per acquisition (CPA): What’s the true cost of acquiring customers?
- Return on ad spend (ROAS): Are you generating profitable returns?
Why timing matters: Judging financial performance too early kills potentially successful campaigns. Most platforms require 15-30 conversions (better: 50+) before their algorithms stabilize, making early financial metrics misleading.
The Danger of Premature ROAS Optimization
ROAS (Return on Ad Spend) is the holy grail of marketing metrics, but it’s also the most dangerous when applied too early.
Here’s why: During the learning phase, platforms like Google Ads test various audience segments to find your ideal customers. This process naturally inflates costs as the system explores less-qualified traffic.
Real examples:
A SaaS client wanted to pause their LinkedIn campaign after three days because CPA was 40% above target. We convinced them to wait and keep refining and optimizing the campaign. By week four, the algorithm had optimized targeting, reducing CPA by 60% while increasing lead quality.
An eCommerce client was running campaigns on a weekly basis. They were frustrated with results. Clearly, the algorithm has little chance to optimize and reach the zone of optimal performance. We suggested and demonstrated extended runtimes of campaign assets. Their impression share increases, the eCommerce conversions improved and the ROAS increased.
The lesson? Give your campaigns time to learn before making financial judgments.
How We Bring Structure and Sanity to Campaign Chaos
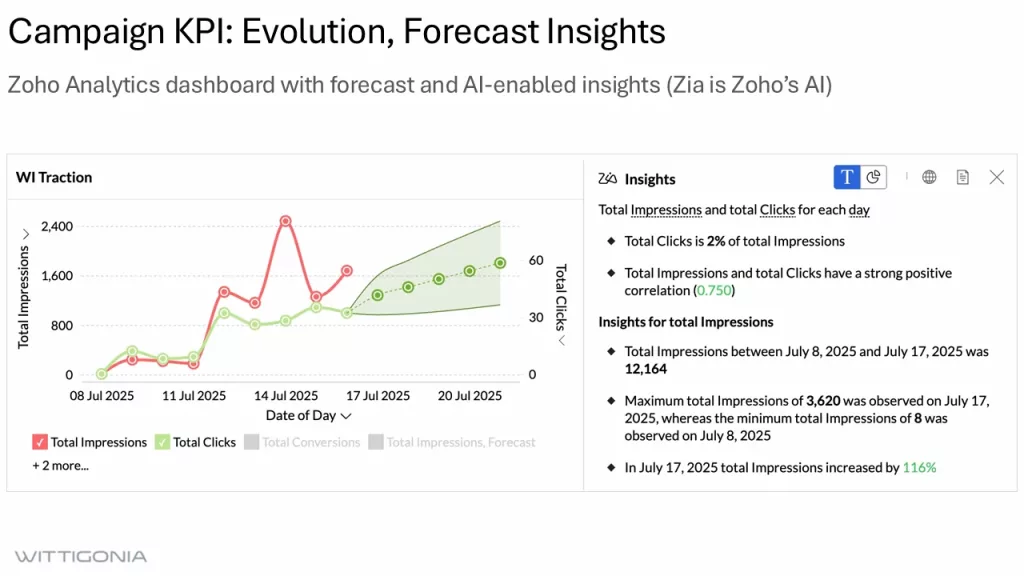
At WITTIGONIA, we work with the dashboard tools of our clients. But we have come to really enjoy Zoho Analytics to create intelligent dashboards that visualize campaign performance by stage. Instead of overwhelming clients with dozens of metrics, we highlight the right KPIs for each phase. More importantly, with Zoho Analytics we can blend the marketing data easily with other datasets from CRM, projects mangement to financials.
Our dashboards typically includes:
- Traction view: Real-time impressions, clicks, and conversion tracking
- Efficiency view: CTR and CVR trends with historical comparisons
- Financial view: CPA, ROAS, and profitability analysis with forecasting
But here’s the critical insight most managers miss: performance tables only tell half the story.
While summary tables show you current numbers, time series charts reveal the trajectory of your campaign. A CPA of $50 looks concerning in a static table, but when you see it dropping from $120 over three weeks, you understand the campaign is optimizing beautifully.
The power of time series visualization:
- Identifies optimization trends that tables can’t reveal
- Shows natural learning curve patterns vs. genuine performance issues
- Prevents premature decisions based on snapshot data
- Reveals seasonal patterns and audience behavior shifts
This dual approach – combining performance tables with time series analysis – eliminates guesswork and reduces the emotional decision-making that kills promising campaigns.

The Cost of Impatience: A Data-Driven Reality Check
Our analysis of 200+ campaigns reveals a clear pattern:
- Campaigns terminated within the first two weeks showed higher campaign failure rates and lower ROAS
- Teams using structured KPI frameworks achieved better ROAS during the testing and optimization phase
- Clients who waited for financial optimization saw lower acquisition costs
The data is clear: patience pays.
Transform Your Campaign Management Today
Stop letting fear and impatience destroy your marketing investment. The solution isn’t more data – it’s better timing.
Your next steps:
- Audit your current metrics: Are you tracking financial KPIs too early?
- Implement the three-stage framework: Give each phase proper attention
- Create structured dashboards: Focus on stage-appropriate metrics
Ready to optimize your approach? We offer complimentary campaign reviews and live demonstrations of our Zoho Analytics dashboards. No sales pitch – just data clarity and actionable insights.
Schedule your campaign review and see how the three-stage KPI framework can transform your marketing performance. Visit our Performance Marketing Services page and click to book a discovery call.
WITTIGONIA helps businesses navigate digital transformation through data-driven marketing strategies, advanced analytics, and systematic optimization. Our Performance Marketing Accelerator and Zoho Analytics services provide the structure and insights needed for sustainable growth.
