
Why Good Companies Lose Great Candidates (And How to Measure It)
Author: Thomas Wittig | Founder, WITTIGONIA | Reading time: approx. 7 minutes
Most of the HR leaders I speak with are not failing at recruiting. They have reasonable budgets, recognisable employer brands, and dedicated teams. They are not ignoring the problem. And they are still losing great candidates they wanted to hire.
The question I keep coming back to is this: if the intent is there and the resources exist, why does the outcome keep falling short?
In most cases, the answer is not a sourcing problem or a budget problem. It is a measurement problem. Specifically, it is the problem of measuring the wrong thing, at the wrong stage, too late to act on it.
This post breaks down where candidates actually leave your process, why it happens at each stage, and what you need to be tracking if you want to fix it systematically rather than reactively.
Your pipeline has three stages. Each one leaks differently.
Think of your recruiting process as a pipeline with three stages. Candidates become applications. Applications move into interviews. Interviews convert into offers. Each stage has a natural rate at which candidates flow through, and a rate at which they leave before you want them to.
Most organisations measure total applicant volume and total hires – often in static dashboard. That is problematic for two main reasons: They miss everything in between. And everything in between is where the real problem lives. And secondly, the recruiting funnel and candidate pipeline is a highly dynamic system. You should be concerned about change over time versus how many CVs you have on the table.
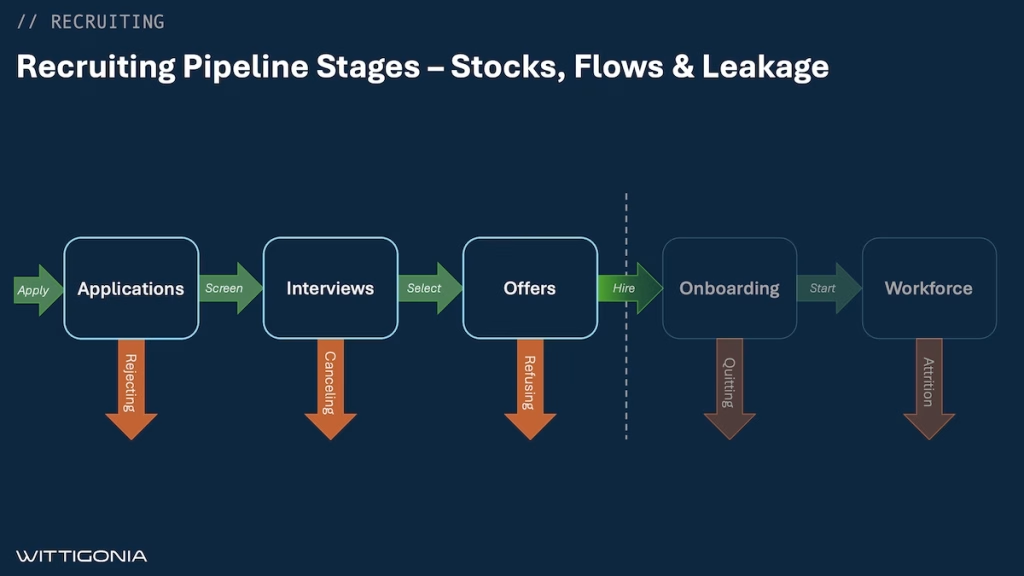
Stage 1: Applications. The conversion problem no one measures.
The most urgent and most underestimated problem in recruiting is what happens before a candidate applies. Or more precisely, what stops them from applying at all?
When I look at the sourcing infrastructure of mid-sized companies, the pattern is consistent. Job postings go live on one or two platforms. Traffic arrives. A fraction converts into applications. The rest leaves. The metric that matters here is your application conversion fraction: how many visitors to your job page actually submit an application, broken down by channel and by role type.
Most organisations do not track this at the role level. They see total applicant volume, compare it to last quarter, and draw conclusions without accounting for sourcing channel quality or how the application experience itself may be filtering out strong candidates before they even start.
An application process that takes 20 minutes on a mobile device is not a process. It is a filter that systematically removes candidates who have other options. Those candidates are usually your best ones.
Fixing this stage does not necessarily require more budget. It requires understanding where traffic is coming from, where it drops off, and what the conversion fraction is by channel. Once you have that data, you can make decisions. Until then, you are guessing.
The metric: Application conversion fraction, by sourcing channel and by role. The urgency level: Highest. This is the widest gate in the pipeline. A small improvement here compounds through every downstream stage.
You may be wondering “Why is he talking about conversion fraction and not conversion rate?”. Good question: In marketing we often use the term “conversion rate“, referring to the the percentage (a fraction) of people making a choice like applying, buying, signing up. This is the fraction of people converting, measured in percent or percent per time. But a “rate” refers to a flow, which is usually measured in Units/Time. For example, the application rate can be measured in People/Month.
Why does it matter? And how cares? This is one of the root causes of misunderstanding and workforce planning challenges. We will dive deeper in this in a separate article.
Stage 2: Interviews. Where speed becomes a competitive variable and quality is decided.
Once candidates are in the pipeline, the clock starts. Not your clock. Theirs.
The Interviews stage is worth defining precisely, because it contains more than the word suggests. In pipeline terms, it holds all candidates who have been screened and confirmed as suitable – but who have not yet received an offer. They are in a waiting position. From this stage, a candidate can progress in exactly one of three ways: receive an offer, become unavailable over time as their search moves on, or have their process cancelled. One inflow, three outflows. The dynamic consequence is that the longer candidates sit in this stage without progressing, the higher the probability they exit through the wrong one of those three doors. Speed is not a courtesy. It is a structural variable.
This is also the stage that functions as your primary candidate reserve. A hiring manager faces a genuine tradeoff: move fast and extend offers quickly, which depletes the pool but fills roles; or keep strong candidates engaged for longer, which preserves optionality but requires active nurturing to prevent them from drifting away. The health of this stock at any point in time falls into one of three states – growing (screening outpaces all outflows, reserve is building), balanced (inflow and outflows roughly match, sustainable steady state), or draining (outflows dominate).
A draining pool requires immediate diagnosis: it looks identical whether candidates are leaving because offers are being extended quickly, or because they are becoming unavailable without receiving one. The response to each is entirely different. A detailed treatment of pool dynamics — including scenario simulations for each state and the targeting and nurturing strategies that determine individual candidate decay rates – is in the companion post on candidate pool dynamics.
Time-to-fill is a well-known metric, but it is almost always tracked as a retrospective average rather than as an active signal. By the time a slow process shows up in your time-to-fill number, the candidate who would have improved that metric has already accepted an offer elsewhere.
The dynamics here are structural. Screening steps that require manual handoffs. Interview scheduling that depends on hiring manager availability. Feedback loops that run on weekly rhythms when the candidate is making decisions daily. Each of these delays compounds. And candidates do not wait indefinitely. They become unavailable. Their attention moves elsewhere, or they accept another role.
The same stage also determines quality. Not every candidate who reaches the interview stage should receive an offer. The question is whether your interview process is actually calibrated to distinguish the ones who should. A pipeline with high applicant volume but low offer conversion is not a sourcing success. It is a matching problem that costs time, money, and hiring manager trust.
The metric: Time-to-fill broken down by stage (not as a single total average). And separately, the ratio of candidates interviewed to offers extended, as a proxy for matching quality. The urgency level: High. Speed and quality are both decided here. Most organisations optimise for neither in a structured way.
Stage 3: Offers. Where the ROI of your entire process is confirmed or lost.
Offer acceptance rate is a tactical metric with strategic implications. If your acceptance rate is below 80 percent for roles where you have reached the offer stage, something broke earlier in the process.
Either the candidate was not fully aligned on the role or the conditions before the offer arrived, which is a communication and engagement problem that belongs in the interview stage. Or the offer itself was not competitive, which is a market intelligence and compensation benchmarking problem. Or the time between final interview and offer was long enough that the candidate’s enthusiasm cooled, or another offer arrived first.
Any of these is fixable. But not without knowing which one you are actually dealing with. That requires tracking offer acceptance by role type, by sourcing channel, and over time, not as a single aggregate figure that tells you what happened but not why.
The metric: Offer acceptance rate, segmented by role type and source channel. The urgency level: Tactical but high ROI. By this stage, you have invested weeks of process time per candidate. A rejection here is expensive.
Key metrics by pipeline stage
| Pipeline Stage | Model Stock | Primary Metric | What It Signals | Consequence of Ignoring |
|---|---|---|---|---|
| Applications | Applications | Application conversion rate | Top-of-funnel health and channel quality | Spending more on ads without improving results |
| Interviews | Interviews | Time-to-fill by stage / Interview-to-offer ratio | Process speed and candidate matching quality | Losing top candidates to faster competitors |
| Offers | Offers | Offer acceptance rate by role and source | Alignment, compensation competitiveness, process experience | High recruiting cost with low yield at the final step |
| Workforce (outcome) | Workforce | Quality of hire / New hire retention | Long-term value of the selection process | Repeating the same role within 12 months |
Why you cannot fix one stage in isolation
This is where the systemic view matters. Each of these three stages is connected. A drop in application quality at stage one shows up as a volume problem at stage two, a quality problem in the offer conversion flow, and ultimately as an understaffing cost that accumulates invisibly week over week.
At WITTIGONIA, we model the recruiting process and talent pipeline as a stock-and-flow consistent system rather than a linear sequence. Each stage is a stock: a level of candidates accumulating and depleting as they move through. The flows between stages are governed by process times, quality thresholds, and budget constraints. The system has feedback loops: a talent gap signals a required hiring rate, which drives ad spend, which drives applications, which drives the pipeline. When one part of the system is constrained, the pressure shows up somewhere else, often in a stage that appears unrelated.
This approach, rooted in system dynamics methodology, makes the pipeline dynamics visible in a way that standard reporting does not. In a later post in this series, I will show you what this model reveals when you run a scenario simulation: what happens to your workforce levels when you cut the recruiting budget for four weeks, and how long it takes to recover. The results are consistently more severe and more delayed than most leadership teams expect.
Frequently asked questions
Why do companies lose good candidates during the hiring process?
Companies lose candidates at three pipeline stages. In the applications stage, the primary cause is low conversion: too few of the right visitors complete the application. In the interviews stage, the primary cause is process speed: candidates accept other offers while waiting for feedback or scheduling. At the offer stage, the primary cause is misalignment on role, compensation, or expectations that was not resolved earlier in the process. In most cases the underlying cause is not a sourcing problem. It is a measurement problem: organisations track outcomes rather than the dynamics of each stage.
What metrics should HR teams track to reduce candidate drop-off?
The three most actionable metrics, mapped to each pipeline stage, are: application conversion rate (visitors to applicants, by channel and role type), time-to-fill broken down by stage rather than as a single total, and offer acceptance rate segmented by role type and source. These three metrics correspond to the three pipeline stocks in a recruitment system model: Applications, Interviews, and Offers.
How do I know if my recruiting process is structurally sound or just performing well in a favourable market?
You run a diagnostic. A structured maturity assessment maps your current process across capability dimensions including sourcing infrastructure, attribution and data tracking, pipeline flow, and AI readiness. It shows you where your process is genuinely strong and where it is dependent on conditions that may not hold when the market tightens or a key role becomes harder to fill.
What to do now
The first step is not to fix anything. It is to measure.
Specifically: where in your pipeline is the biggest drop between candidates entering a stage and candidates progressing to the next? What is your current time between a candidate completing an interview and receiving an offer? And what percentage of offers extended in the past 90 days were accepted?
If you can answer all three questions with actual numbers today, your measurement infrastructure is ahead of most organisations at your size. If you cannot, that is the real problem to solve first.
I built a short Recruiting Maturity Assessment that maps your current process across ten capability dimensions. It takes less than five minutes. You receive a personalised report with specific, dimension-by-dimension recommendations immediately after. It is free and you are welcome to use it.
Take the free Recruiting Maturity Assessment or learn about the Recruiting Maturity Model and Diagnostics tool.
This is the first post in a series on recruiting strategy, pipeline dynamics, and data-driven talent acquisition. Upcoming topics include stock-and-flow consistent dashboards, the dynamics of candidate pools and talent audiences, and SEO strategy for job postings and career portals.
Thomas Wittig is the founder of WITTIGONIA, a recruiting strategy and implementation firm helping growth-oriented companies across Europe build structured, data-driven talent acquisition systems. Learn more about Thomas or explore our services.
Related: WITTIGONIA Insights | Technical notes: lab.wittigonia.net