
Recruitment Marketing Campaign KPI Calculator: From Budget to Hires
Thomas Wittig · Published 7 October 2020 · Updated 22 September 2026
Every recruitment marketing campaign answers one of two questions. Either you have a budget and need to know what it will produce, or you have a hiring target and need to know what it will cost. This recruitment marketing budget calculator answers both, stage by stage, from ad clicks to hires.
I first published this calculator in 2020, after optimising recruitment marketing budgets for companies and public organisations. The 2026 version is rebuilt from scratch: fewer inputs, one consistent funnel, and scenarios you can share as a link. The logic is the one we use in client campaigns. A hire is the output of a chain of conversion rates, and the media budget only pays for the first link in that chain.
In short
- Hires = Budget ÷ CPC × Application Rate × Qualifying Rate × Offer Rate × Offer Acceptance Rate.
- At the calculator defaults, a budget of €3,000 produces about 11 hires at a media cost per hire of about €278.
- Conversion rates are budget levers, and so is knowing your real cost per click. In Case Study 1 below, using real Google Ads data instead of a planning assumption cut the projected budget by a factor of twelve.
- Every campaign builds two assets beyond hires: a Talent Audience for retargeting and a Talent Pool your organisation owns.
Set your own assumptions below. The defaults are illustrative; replace them with your campaign data where you have it.
Recruitment Marketing Campaign KPI Calculator
What budget does your recruitment marketing campaign need — and what will it produce? Work from your budget to an expected outcome, or from a hiring target back to the budget required.
Your Results
Funnel from ad clicks through applications, interviews and offers to expected hires, with a parallel branch showing the retargetable Talent Audience built from consenting clicks. When a baseline is saved, each stage shows a muted baseline bar alongside the current scenario, with the percentage difference.
View all assumptions as a table
Clicks → Applications → Interviews → Offers → Hires
How the recruitment marketing funnel calculation works
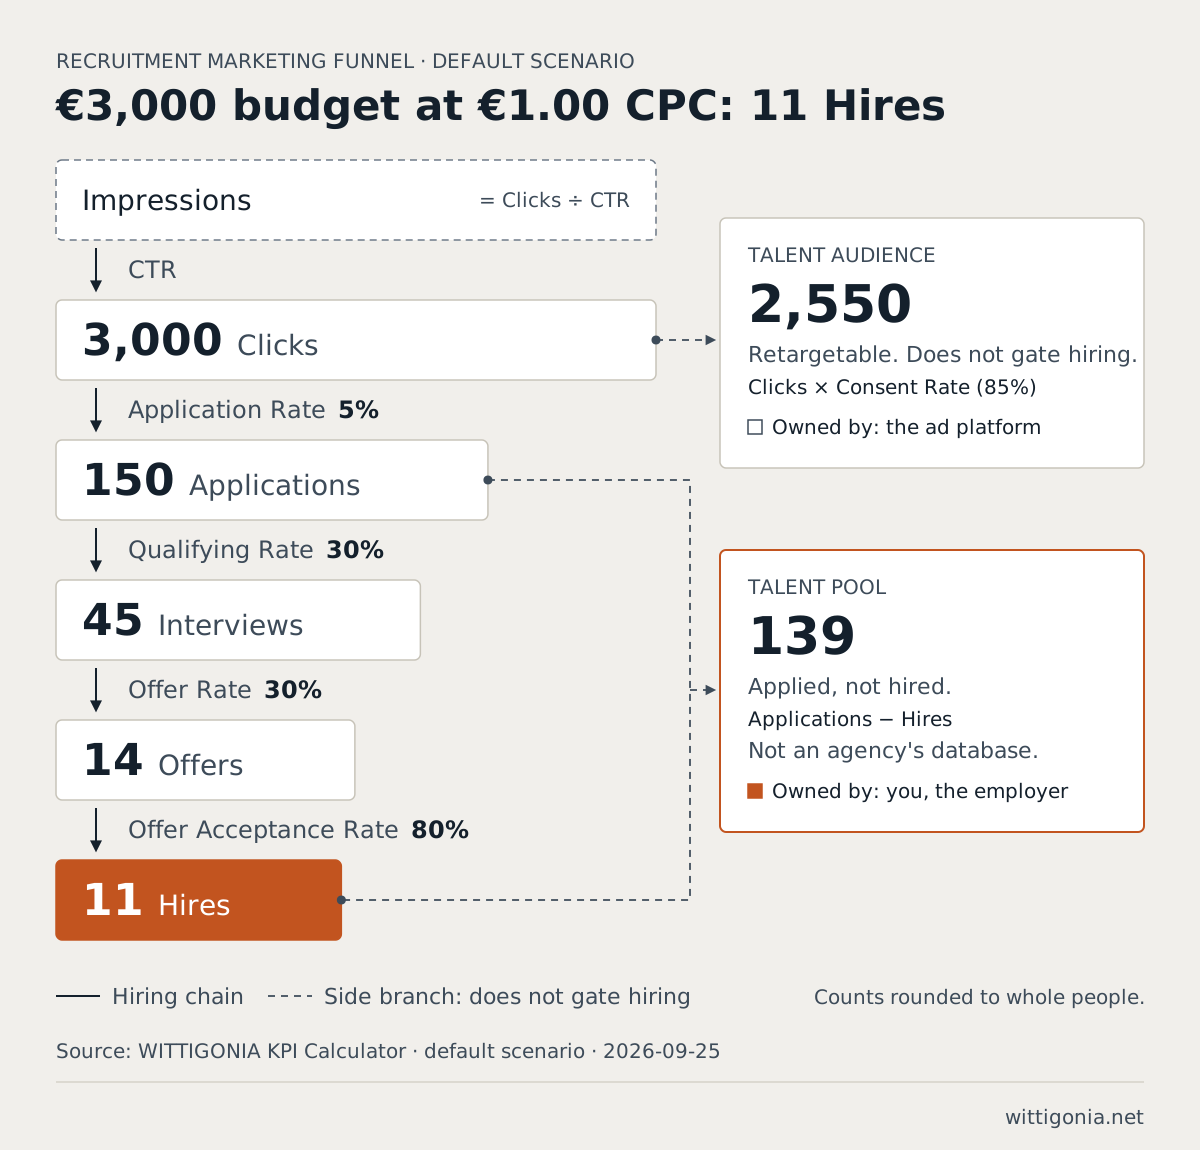
Budget buys clicks. Everything after the click is conversion, and conversion is where most campaigns lose their money. The calculator makes each conversion step explicit, so you can see which one limits your hires.
Five stages, four conversion rates
| Step | Rate | Default | What moves it in practice |
|---|---|---|---|
| Clicks to Applications | Application Rate | 5% | Job ad relevance, landing page speed, length of the mobile application form |
| Applications to Interviews | Qualifying Rate | 30% | Targeting precision, clear requirements in the ad, screening speed |
| Interviews to Offers | Offer Rate | 30% | Interview capacity, hiring manager calibration |
| Offers to Hires | Offer Acceptance Rate | 80% | Pay, time from interview to offer, competing offers |
The rates multiply. At the defaults, 1,000 clicks produce 50 applications, 15 interviews, between 4 and 5 offers and between 3 and 4 hires. A weak stage cannot be compensated by budget without paying for the loss at every stage above it.
Budget-Driven or Target-Driven
The calculator runs in two directions, and both use the same chain.
- Budget-Driven: “I have € X. What will it produce?” Clicks = Budget ÷ CPC, then each rate is applied in sequence.
- Target-Driven: “I need N hires. What budget do I need?” The chain runs backwards from the hiring target.
Budget = (Hires × CPC) ÷ (Application Rate × Qualifying Rate × Offer Rate × Offer Acceptance Rate)
The two modes are exact inverses. A budget calculated in Target-Driven mode returns the same hiring target when entered in Budget-Driven mode.
What CTR changes, and what it does not
Click-Through Rate (CTR) sets the impression volume you need: Impressions = Clicks ÷ CTR. It does not change cost or hires in this model, because you pay per click, not per impression. Use it as a reality check. At the defaults, 3,000 clicks at a 5% CTR require 60,000 impressions. If your target region and role do not produce that search volume in the campaign period, the plan fails at the top, whatever the budget.
Talent Audience and Talent Pool: what a campaign builds besides hires
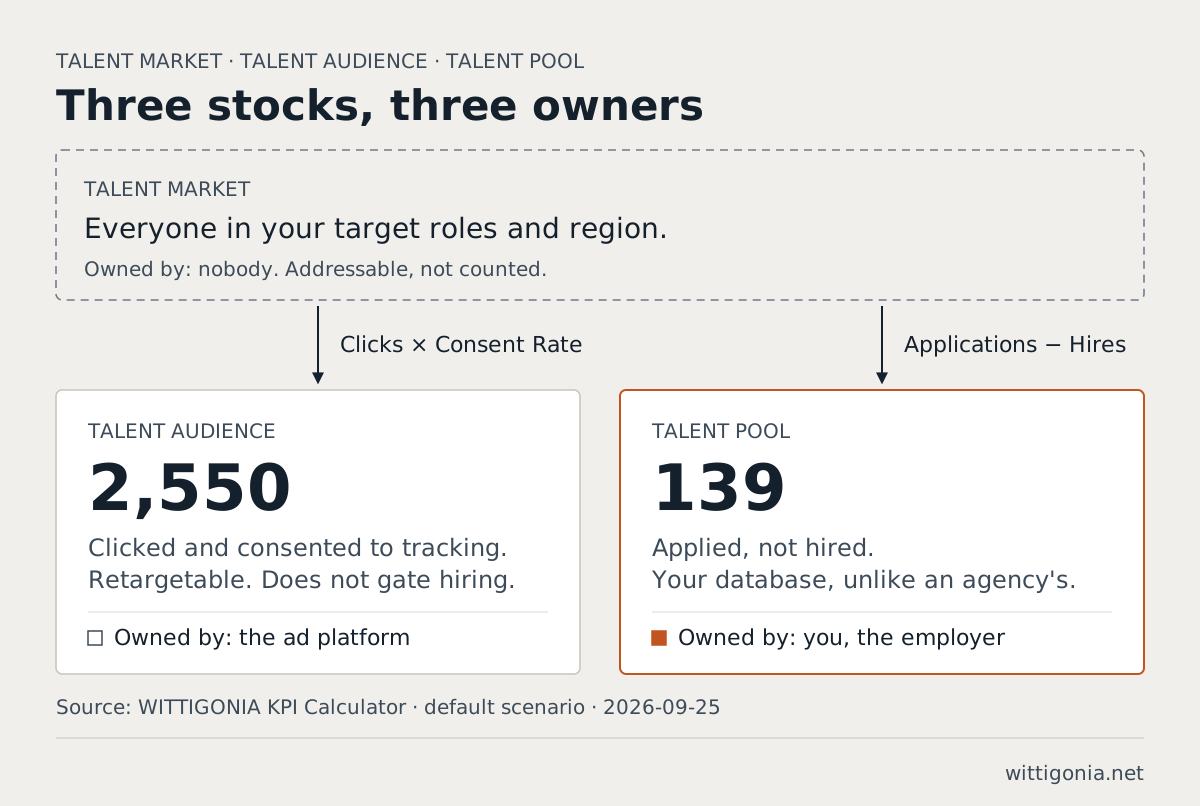
- Talent Audience = Clicks × Consent Rate. These are visitors who accepted tracking in your consent banner (CMP) and can be retargeted in later campaigns. Consent does not gate hiring: a candidate who declines tracking can still apply and be hired.
- Talent Pool = Applications − Hires. These are applicants you did not hire this time, retained (with their consent) for future roles.
The Talent Pool is the asset most organisations underrate. A recruitment agency keeps its candidate database and supplies candidates one by one. A campaign you run yourself builds a pool your organisation owns. At the defaults, €3,000 adds 139 applicants to that pool and 2,550 people to the retargeting audience. Storage periods and consent rules differ by country; this is not legal advice.
The four media cost KPIs
The calculator reports four cost KPIs. All four are media cost only: ad spend divided by an outcome.
| KPI | Formula | Default scenario (€3,000) | What it tells you |
|---|---|---|---|
| Cost per Hire (CPH) | Budget ÷ Hires | €278 | The media cost of one hire; compare with agency fees and other channels |
| Cost per Application | Budget ÷ Applications | €20 | Efficiency of ad plus landing page |
| Cost per qualified Candidate | Budget ÷ Interviews | €67 | Efficiency of targeting: are you paying for applicants you will not interview? |
| Cost per Candidate | Budget ÷ Talent Audience | €1 | Cost of building your retargeting audience |
A complete cost per hire also includes recruiter and hiring manager time, creative production, tools such as the applicant tracking system, and onboarding. The calculator deliberately leaves these out, because they vary more by organisation than by campaign. To compare the result against an agency fee or your current channel mix, use the Recruiting Marketing ROI Calculator.
Case studies: three European hiring campaigns calculated
The three roles below are in demand across Germany and much of Europe. The Federal Employment Agency’s 2025 bottleneck analysis lists 157 bottleneck occupations, including nursing, truck drivers, electrical engineering and heating and air-conditioning trades (BA Fachkräfteengpassanalyse 2025). Each case uses a different funnel shape, because the constraint sits at a different stage.
Data baseline: 2026 Q3. CPC and CTR below come from Google Ads Keyword Planner forecasts run in September 2026. Cost per click moves with the market, so this page will be updated with a new baseline periodically — that update is what keeps a calculator article like this current for both readers and search.
Case Study 1: Registered nurses for a hospital group (Germany, 2026 Q3 data)
A hospital group needs 12 registered nurses for two sites. CPC, CTR and Application Rate below are real: Google Ads Keyword Planner forecast for “job pflege” and “stellenangebot pflegefachkraft”, Germany, October 2026, plus Thomas’s own field range for CMP consent (65–85%, applied at 75%). Qualifying Rate, Offer Rate and Offer Acceptance Rate remain illustrative pending campaign data. Mode: Target-Driven.
Switching from planning assumptions to this real cost-per-click changed the case by more than a small correction: at an assumed €2.80 CPC and a 5% Application Rate, the same 12 hires looked like a €6,564 campaign. At the real €0.26 CPC this market is currently returning, with a more conservative 4% Application Rate, the same 12 hires cost €533. A campaign plan built on an assumed CPC three to four times the real one overstates budget by a similar factor. Check your own Keyword Planner numbers before setting a budget — do not plan from industry-wide CPC assumptions.
| Input | Value | Source | Output | Value |
|---|---|---|---|---|
| Hiring target | 12 hires | – | Budget required | €533 |
| Cost per Click | €0.26 | Google Ads Keyword Planner, Oct 2026 | Clicks | 2,051 |
| CTR | 5.3% | Google Ads Keyword Planner, Oct 2026 | Impressions needed | 38,703 |
| Application Rate | 4% | Field estimate, lower end of market range | Applications | 82 |
| Qualifying Rate | 45%* | Illustrative | Interviews | 37 |
| Offer Rate | 50%* | Illustrative | Offers | 18 |
| Offer Acceptance Rate | 65%* | Illustrative | Hires | 12 |
| Consent Rate | 75% | Field range 65–85% | Cost per Hire (media) | €44 |
| Cost per Application | €7 | |||
| Talent Pool / Talent Audience | 70 / 1,538 |
* Not yet confirmed against a live campaign; replace when available.
A narrow, two-keyword ad group is not a full campaign. Expanding to more job titles, shifts and locations will reach more of the market and will very likely raise the average CPC above €0.26; treat this figure as a floor, not a guarantee. Open this scenario in the calculator
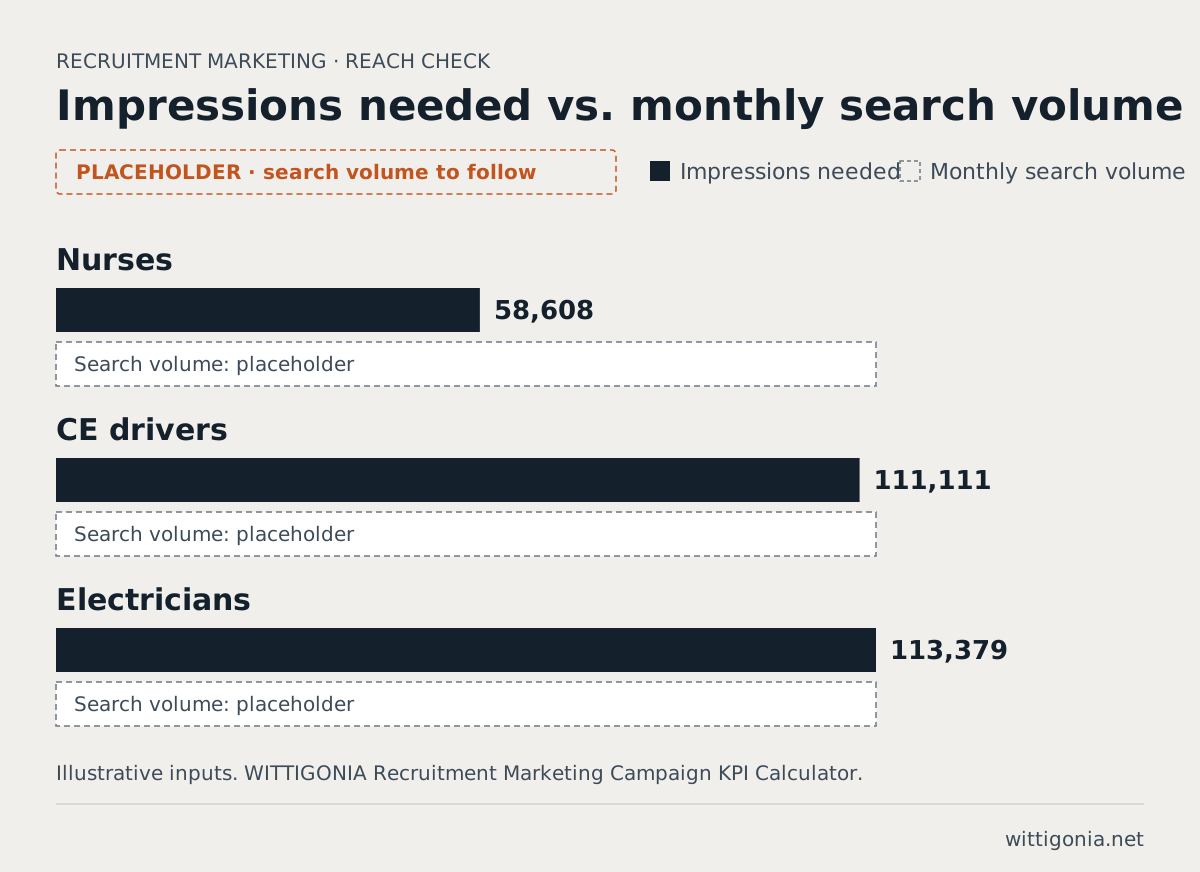
Estimating the addressable market from a narrow campaign. Keyword Planner no longer reports historical monthly search volumes, only broad ranges (“1K–10K/month”). A practical workaround for an active campaign: read the Search Impression Share for your ad group from Google Ads, then divide your Impressions by that share. Impression Share of 20% at 20,000 impressions implies roughly 100,000 impressions are available in the market for those terms — five times what the campaign is currently capturing. This needs a live campaign’s Impression Share, which we do not yet have for this ad group; the figure above is left open until it is available.
Case Study 2: CE truck drivers for a logistics operator (Germany, 2026 Q3 data)
A logistics operator has €10,000 for a driver campaign and wants to know the yield. CPC and CTR below are real: Google Ads Keyword Planner forecast for “berufskraftfahrer jobs”, “lkw fahrer jobs”, “fernfahrer jobs” and “stellenangebote berufskraftfahrer”, Germany, October 2026. Application Rate follows the same conservative reasoning as Case Study 1; Qualifying Rate, Offer Rate and Offer Acceptance Rate remain illustrative pending campaign data. Mode: Budget-Driven.
The search market here looks stable rather than growing: Keyword Planner’s own 12-month projection holds close to 5,000–6,000 weekly impressions for these terms, without the seasonal spikes a retail or hospitality role would show.
| Input | Value | Source | Output | Value |
|---|---|---|---|---|
| Budget | €10,000 | – | Clicks | 33,333 |
| Cost per Click | €0.30 | Google Ads Keyword Planner, Oct 2026 | Impressions needed | 653,595 |
| CTR | 5.1% | Google Ads Keyword Planner, Oct 2026 | Applications | 1,333 |
| Application Rate | 4% | Field estimate, lower end of market range | Interviews | 333 |
| Qualifying Rate | 25%* | Illustrative | Offers | 167 |
| Offer Rate | 50%* | Illustrative | Hires | 117 |
| Offer Acceptance Rate | 70%* | Illustrative | Cost per Hire (media) | €86 |
| Consent Rate | 75% | Field range 65–85% | Cost per qualified Candidate | €30 |
| Talent Pool / Talent Audience | 1,217 / 25,000 |
* Not yet confirmed against a live campaign; replace when available.
This is where the case study turns into a systems point rather than a media-buying one: 1,333 applications and 333 interviews in a month is more screening volume than most single-site logistics recruiting teams can process. At this real CPC, the constraint moves from ad budget to hiring-process capacity — a structural bottleneck, not a spending one. Open this scenario in the calculator
Case Study 3: Electricians and heat pump installers for a building services firm (Germany) — pending real data
A building services firm needs 20 electricians and heating installers for heat pump projects. Skilled tradespeople apply rarely and compare employers closely, so every stage is moderate. Mode: Target-Driven.
| Input | Value | Output | Value |
|---|---|---|---|
| Hiring target | 20 hires | Budget required | €11,224 |
| Cost per Click | €2.20 | Clicks | 5,102 |
| CTR | 4.5% | Impressions needed | 113,379 |
| Application Rate | 4% | Applications | 204 |
| Qualifying Rate | 35% | Interviews | 71 |
| Offer Rate | 40% | Offers | 29 |
| Offer Acceptance Rate | 70% | Hires | 20 |
| Consent Rate | 80% | Cost per Hire (media) | €561 |
| Cost per Application | €55 | ||
| Talent Pool / Talent Audience | 184 / 4,082 |
The 184 applicants in the Talent Pool are the start of the next campaign: they already know the employer and have applied once. Open this scenario in the calculator
What the case studies show: conversion is a budget lever
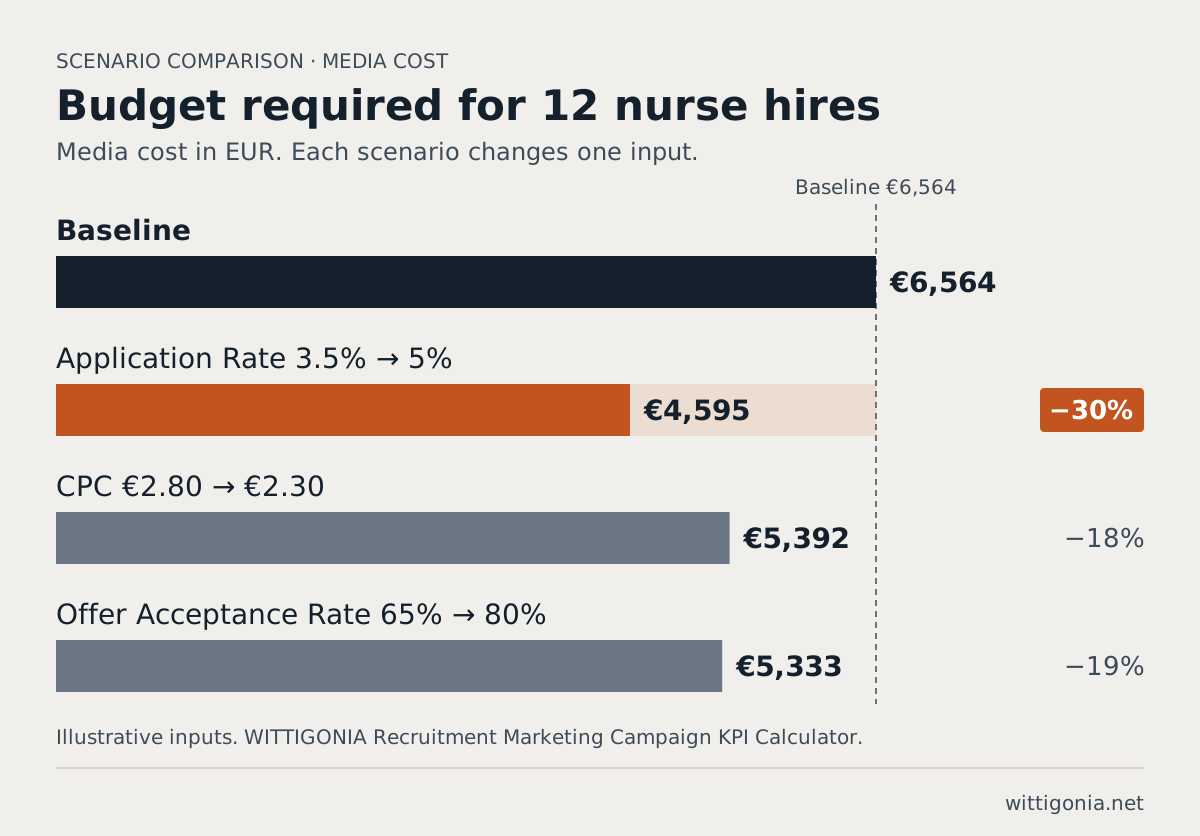
Take Case Study 1 at its real €0.26 CPC and change one input at a time. The hiring target stays at 12.
| Scenario (Case Study 1, real CPC €0.26) | Budget required | Change | Cost per Hire (media) |
|---|---|---|---|
| Baseline | €533 | – | €44 |
| Application Rate 4% to 5% (shorter mobile form) | €427 | -20% | €36 |
| Offer Acceptance Rate 65% to 80% (faster offers) | €433 | -19% | €36 |
| CPC €0.26 to €0.20 (quality score, ad relevance) | €410 | -23% | €34 |
The single biggest lever in Case Study 1 was not a funnel stage at all: it was replacing an assumed CPC with the real one from Keyword Planner, which changed the budget by 12x before any funnel optimisation. Once you are working from real cost data, the remaining levers cluster tightly — a shorter mobile application, faster offers and better ad quality all save 19–23%. None of them is dramatically better than the others; run your own numbers rather than assuming one lever dominates.
Frequently asked questions about recruitment marketing budgets and KPIs
1. What is a recruitment marketing budget calculator?
A recruitment marketing budget calculator estimates what a job ad campaign will produce, or what it will cost to reach a hiring target. It multiplies the clicks your budget buys by four conversion rates: Application, Qualifying, Offer and Offer Acceptance. The WITTIGONIA calculator is free and reports hires plus four media cost KPIs.
2. How do I calculate the budget needed to hire a given number of people?
Divide the hiring target by the product of your four conversion rates to get the clicks you need, then multiply by your cost per click. Budget = Hires × CPC ÷ (Application Rate × Qualifying Rate × Offer Rate × Offer Acceptance Rate). The calculator’s Target-Driven mode does this for you.
3. What are the most important recruitment marketing KPIs?
The core KPIs are the four conversion rates along the funnel and four media cost KPIs: Cost per Hire, Cost per Application, Cost per qualified Candidate and Cost per Candidate. Volume metrics complete the picture: clicks, impressions needed, Talent Audience and Talent Pool.
4. How much does an online recruitment marketing campaign cost?
The media cost depends on your cost per click and your conversion rates, and both vary far more by role and by campaign than most planning guides assume. In Case Study 1, real Google Ads Keyword Planner data for nursing job searches in Germany gave a cost per click of €0.26, against a €2.80 planning assumption for the same role — a tenfold difference that changed the projected budget by more than 12x. Pull your own Keyword Planner numbers before setting a budget; do not plan from an industry-wide CPC figure.
5. What is the difference between Talent Market, Talent Audience and Talent Pool?
The Talent Market is everyone in your region with the skills you need. The Talent Audience is the share who clicked your ads and consented to tracking, so you can retarget them. The Talent Pool is applicants you did not hire this time and retain, with their consent, for future roles.
6. Why does an owned Talent Pool matter?
A recruitment agency keeps its candidate database and presents candidates one at a time. A campaign you run yourself builds a pool your organisation owns and can contact again at no media cost. Each campaign then starts from a larger base than the last.
7. What is the Consent Rate, and does it affect hiring?
The Consent Rate is the share of visitors who accept tracking in your consent banner (CMP). It sets the size of your retargeting audience. It does not affect hiring: a visitor who declines tracking can still apply and be hired.
8. What is the Qualifying Rate?
The Qualifying Rate is the share of applications that pass screening and reach an interview. A low Qualifying Rate means you pay for applications you will not use. It usually points to targeting or to unclear requirements in the job ad.
9. What is CTR, and why does it not change cost per hire in this calculator?
Click-Through Rate is the share of people who see your ad and click it. You pay per click, so CTR does not change cost or hires in this model. It sets the impressions you need: Impressions = Clicks ÷ CTR. Check that number against the search volume available.
10. How do I find the search volume for job ads in my region?
Use Google Ads Keyword Planner or Microsoft Advertising’s keyword tools, filtered by role and location. Compare the monthly search volume with the impressions the calculator says you need. If the market is smaller, extend the campaign period, the region or the channel mix.
11. What cost per click should I assume for job ads?
Pull it from your own Google Ads Keyword Planner forecast for the exact search terms candidates use, filtered to your region. CPC varies enormously by role and by how scarce the candidate pool is: a Keyword Planner forecast for German nursing job searches showed €0.26, while broader planning guides for the same role suggest figures ten times higher. Trust the forecast over a rule of thumb.
12. How can I improve recruitment campaign performance?
Start with the assumption you are most confident in, not the stage you can see most easily. Check your real cost per click in Google Ads Keyword Planner before optimising anything else — in Case Study 1, using the real CPC instead of a planning assumption changed the required budget by a factor of twelve, far more than any funnel improvement could. Once your cost data is real, the usual levers are a shorter mobile application, clearer requirements in the ad, faster interview scheduling and faster offers.
13. What does media cost per hire include, and what does it leave out?
It includes ad spend only. It leaves out recruiter and hiring manager time, creative production, tools such as the applicant tracking system, and onboarding. Use it to compare campaigns and channels, not as a complete cost per hire.
14. How is this calculator different from the Recruiting Marketing ROI Calculator?
This calculator answers what a budget produces and what a hiring target costs. The Recruiting Marketing ROI Calculator compares that cost with your current hiring method, such as agency fees, and shows the return. Use this one to plan the campaign, the ROI calculator to justify it.
15. Are the results guaranteed?
No. The calculator provides estimated performance metrics. Individual results vary and depend on other factors, including seasonality, competition and your process. The results are not an offer or a contract. The calculator is free and provided as is; we welcome feedback.
16. Can the calculator show how a campaign develops over time?
Not yet. The calculator is static: it shows the result of one campaign period. We are developing a dynamic simulation of the same funnel that shows how applications, interviews and hires build up week by week. It will support workshops and scenario planning.
17. How do I estimate the total addressable search volume, when Keyword Planner only gives a range?
Keyword Planner no longer reports precise historical monthly search volumes, only broad bands such as “1K–10K/month”. If you already have a live campaign for the role, read its Search Impression Share from Google Ads and divide your Impressions by that share. An Impression Share of 20% at 20,000 impressions implies roughly 100,000 impressions are available in the market for those terms — five times what the campaign currently captures. This needs an active campaign; it does not work from Keyword Planner data alone.
Next step: test the numbers against your process
The calculator shows what your assumptions produce. Whether your process can deliver those rates is a different question, and it is usually where the budget is won or lost.
- Talk it through: Book a free initial discovery call. Bring a scenario link from the calculator and we will go through your funnel stage by stage.
- Check your process first: The Recruiting Maturity Assessment maps your recruiting process across ten capability dimensions and shows where the structural bottlenecks are. It is free.
- Compare with your current channels: Use the Recruiting Marketing ROI Calculator to set the media cost per hire against agency fees.
Thomas Wittig is the founder and managing director of WITTIGONIA GmbH in Heidelberg. A systems engineer and former enterprise executive, he builds data-driven recruiting and growth systems for companies and public organisations, combining system dynamics simulation, stock-and-flow consistent analytics in Zoho and digital campaigns. LinkedIn · Profile
Update history: First published 7 October 2020. Updated 22 September 2026: new calculator with Budget-Driven and Target-Driven modes, Qualifying Rate and Talent Pool; case studies (baseline data: 2026 Q3); revised FAQ. The previous version used an embedded third-party calculator that has been retired. Case study CPC and CTR figures are refreshed periodically as market data changes — check the data baseline noted at the start of each case study.