
Two-sided risk is the part most dashboards miss entirely. A drop in lead flow puts revenue at risk. A spike in demand strains delivery before you’re ready for it. Most reporting only watches for one of these. A proper anomaly detection setup watches for both. In this article we are sharing an example of Zia Anomaly Detection in Zoho CRM sales lead flow.
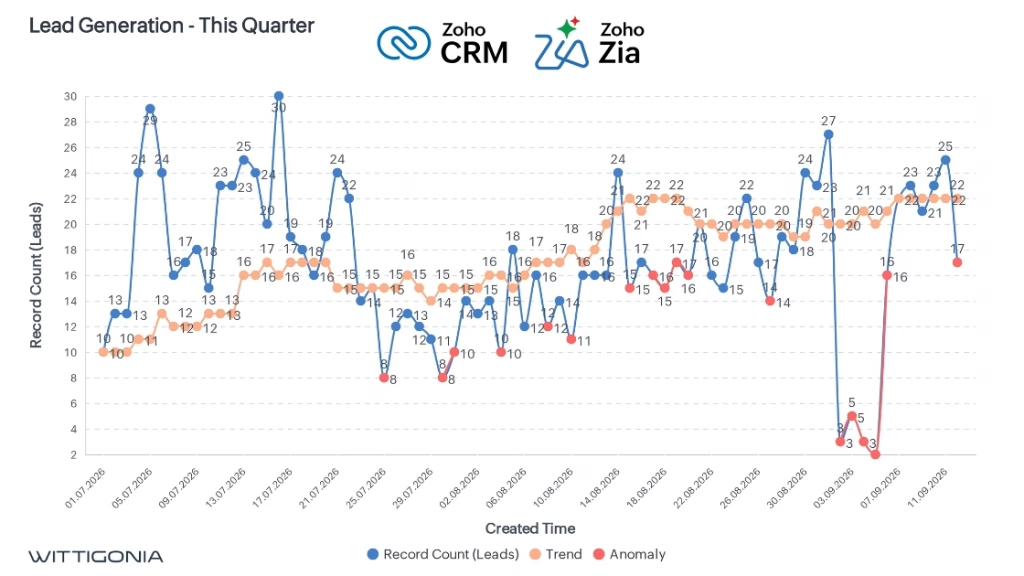
Here’s what that looks like on a real Zoho CRM instance, with Zia AI running anomaly detection on daily lead volume.
The 20-to-3 collapse
Between 3 and 7 September, daily lead count fell from 27 to 5, then to 3, then held at 3. Zia flagged all three low days as anomalies, correctly, immediately, no delay on the detection itself.
But look at the trend line underneath it. It stayed near 20 for several of those same days before it caught up to what had already happened. The individual anomalies were caught in real time. The system’s sense of “normal” took longer to update.
That’s not a flaw to hide. It’s exactly what’s happening, and it’s worth explaining rather than glossing over.
Why the trend line lags right now
This dashboard runs on a Zoho CRM instance that recently migrated from a previous system. New CRM, new data history, and Zia’s trend modeling is still in its learning phase, it hasn’t yet seen enough of this specific organization’s normal rhythm to build a tight baseline.
You can watch it narrow in over the quarter shown here. Early July, actual and trend track closely. Through July and August, as more data accumulates, the gap during volatile stretches gets visibly smaller. By the time you reach September, the anomaly flags are precise even while the trend line is still catching up on the smoothed view.
This is the part worth remembering: detection precision improves with data volume and time, not instantly at go-live. Anyone standing up anomaly detection on a freshly migrated CRM should expect this exact pattern, sharp individual-point detection early, smoother trend accuracy following a few weeks or months behind.
Three flows worth watching with Zia Anomaly Detection, not just one
Lead flow is the obvious place to look, but it’s not the only one:
- Marketing and sales, lead flow, pipeline velocity, exactly what’s shown above
- Customer success and retention, churn signals, usage drops
- Product and service delivery, capacity, throughput
Each of these can move in either direction, and each direction carries a different kind of risk. A dashboard built to catch only the downside misses the version of this problem that shows up as a spike your operation isn’t staffed to handle.
What to do with this
If your CRM or core operating data has changed recently, migration, new implementation, a new module going live, expect your anomaly detection to need a learning window, not because the tool is wrong, but because that’s structurally how trend detection works. Watch the gap narrow. Don’t discard the tool because week one isn’t perfect.
We’re preparing a deeper piece on which specific touchpoints across sales, marketing, and delivery are critical enough that they warrant this kind of monitoring, and which ones don’t need it. That’s next.
[Book a Dashboard Review →] [Zoho Optimization →]
About the Author
Thomas Wittig is a Zoho CRM, Analytics, and Creator certified consultant and founder of WITTIGONIA. He writes about applied AI in business systems, tested on WITTIGONIA’s own infrastructure before being recommended to clients.

AI-assisted · Learn more at wittigonia.net/ai/
This article was created and contributed by Thomas Wittig’s with refinement by AI. WITTIGONIA labels AI-assisted or AI-generated content for transparency.